Editor’s lead: As a product manager, besides dealing with various product requirements every day, data analysis is also a skill that product managers need to master when dealing with business; After the product manager learns some data analysis skills, he will be more comfortable with the subsequent products and business; The author of this article shared three basic skills of data analysis for product managers. Let’s take a look.

Data analysis that is out of business is all hooliganism, so before writing this article on data analysis skills, I assume a business scenario: a product manager of a daily chemical e-commerce wants to find out what aspects can be used to reduce costs and increase efficiency through the sales data in September 2020, and make the next strategic direction according to the data analysis results during the monthly report.
So what should we do according to these three skills? Let’s show them one by one.
As a product manager, you may wonder why you should learn to fetch numbers. Just find someone from the data group to do such a small thing.
That’s true, but imagine that you can’t only have this demand, and you will meet all kinds of demands later, such as:
- A new function is launched on the product, and you want to check the user’s usage of this new function;
- Check the abnormal value of data, and attribute the product before and after it goes online;
- Data comparison of new and old versions of products and user usage;
- The penetration of different portrait users to a certain function, function retention, etc.;
- Data report requirements of different products, monitoring product data.
To solve these problems, you think that the demand for extracting data will be solved, but it is not. You will encounter the following difficulties:
First:Many of the data requirements you mentioned are personalized and one-off. For data students, unless you are a very important business department, or the data department serves your department; Then the students in the data group must realize your requirements, otherwise many of these requirements will not be improved for them, and they will be bored over time.
Second:A company or a team, not only you have a product demand, but also a number of students in the operation group or a number of product groups have demand, and when asked about the urgency, everyone will say that it is urgent.
At this time, the demand scheduling will be involved, and you are also anxious. The students in the better data group will definitely say that I will do it after your internal consultation, and those with bad temper will say that they will not do it. If your demand may not be so urgent, but it is very important for you to verify a problem or the next planning of the product, do you have to wait all the time? You can wait, but the market won’t wait for you.
Third:The demand for withdrawal is only a business support, and it will not produce any output for the students in the data group, nor will it reflect the value of data analysts, nor will it reflect others’ year-end reports.
Some people say that having a good relationship with colleagues in the data group can help you at a critical moment. If you are always doing something like this, you will delay people’s working hours, waste time and have no tangible benefits. Just invite them to have a meal or two and drink a cup of milk tea. People care about each other. People will help you and hope that one day you can help him in turn. Don’t always think about being a bloodsucker who only sucks but doesn’t give.
The so-called skills are not overwhelming, and learning to take numbers is not only convenient for people, but also convenient for themselves; You can have a good relationship with the students in the data group, and ask them to teach you some quick retrieval skills, so that when you encounter important and helpless retrieval needs, you can solve them yourself without delaying work efficiency.
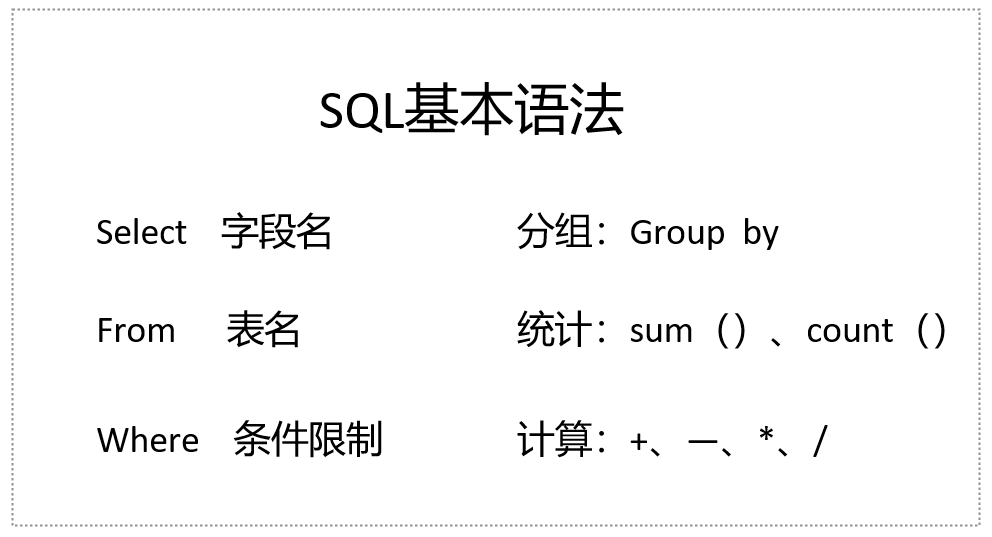
Among the retrieval skills, what we need to cultivate most is SQL skills. When retrieving numbers, it is enough for us to realize most operations by basically using some basic syntax of SQL.
The basic syntax of SQL includes Select, From and Where, and the basic functional syntax includes grouping, statistics, addition, subtraction, multiplication and division. If you can understand English words, you can understand the meaning of SQL grammar.
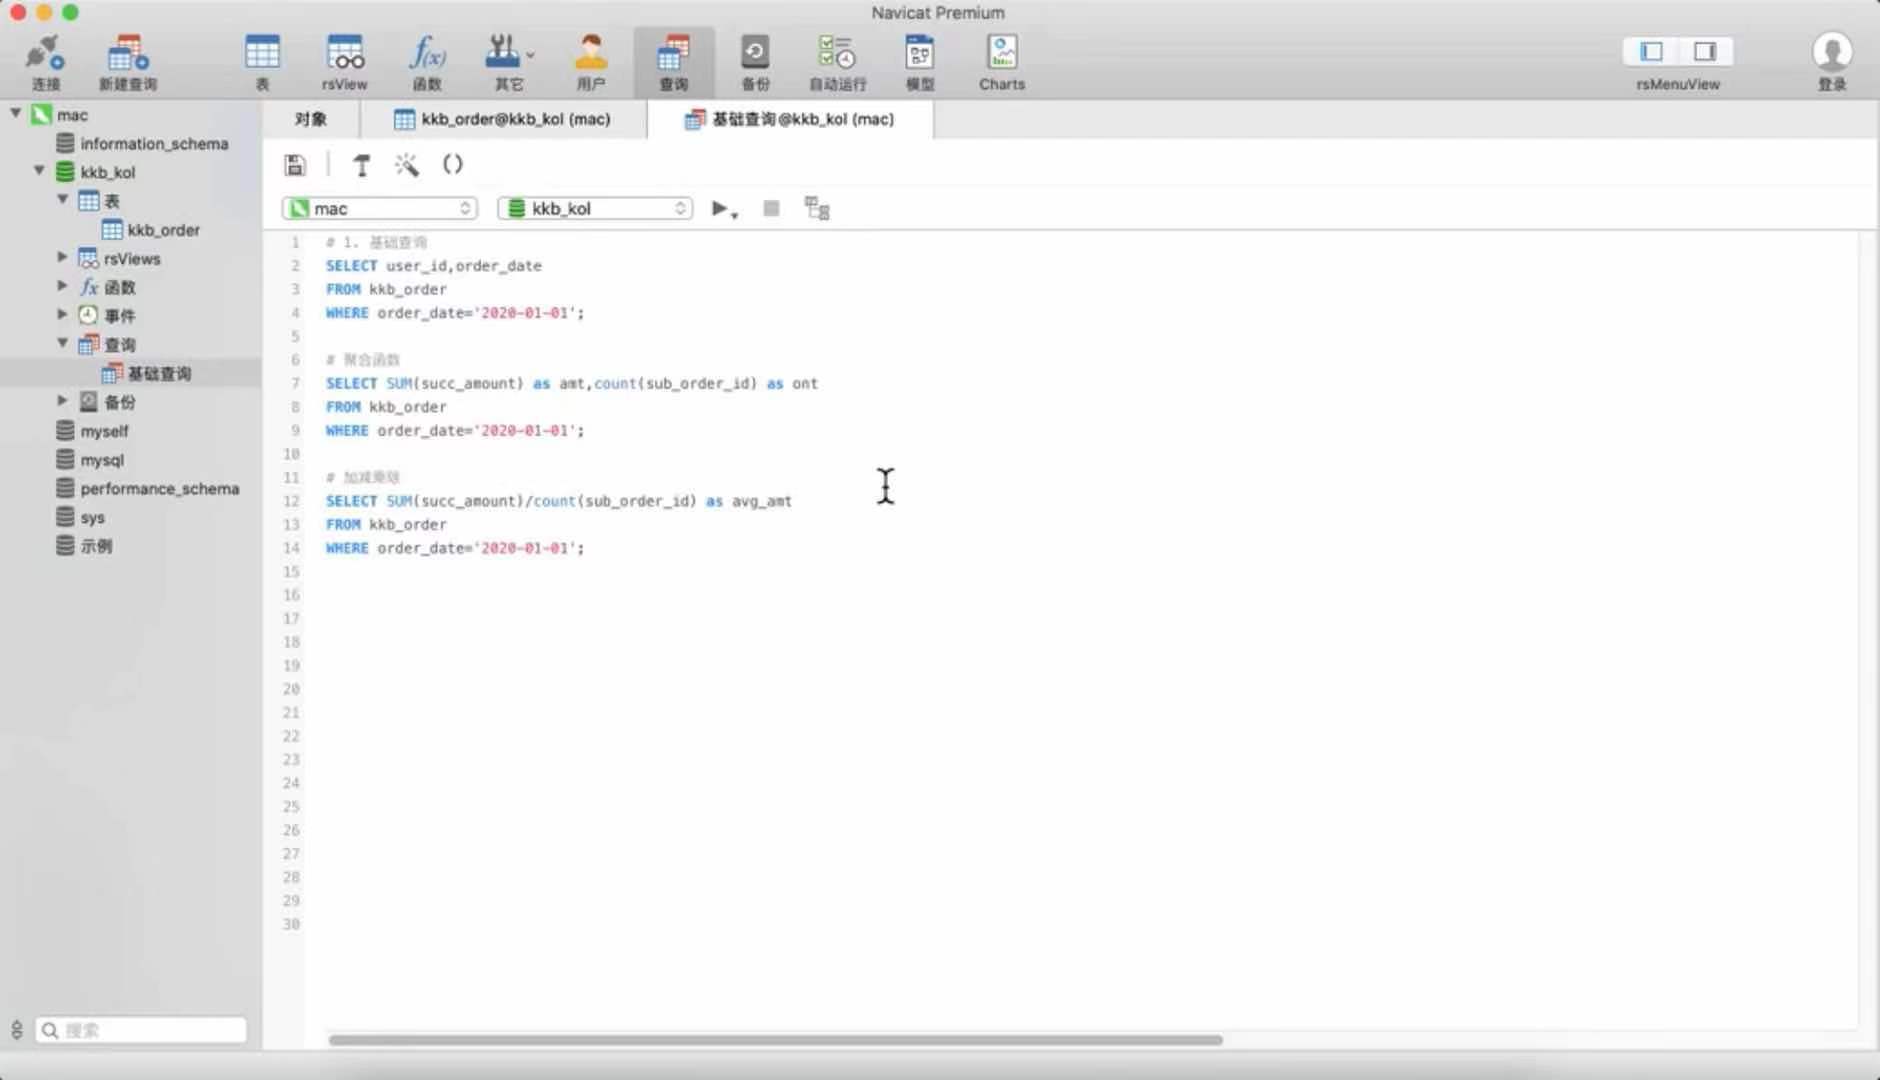
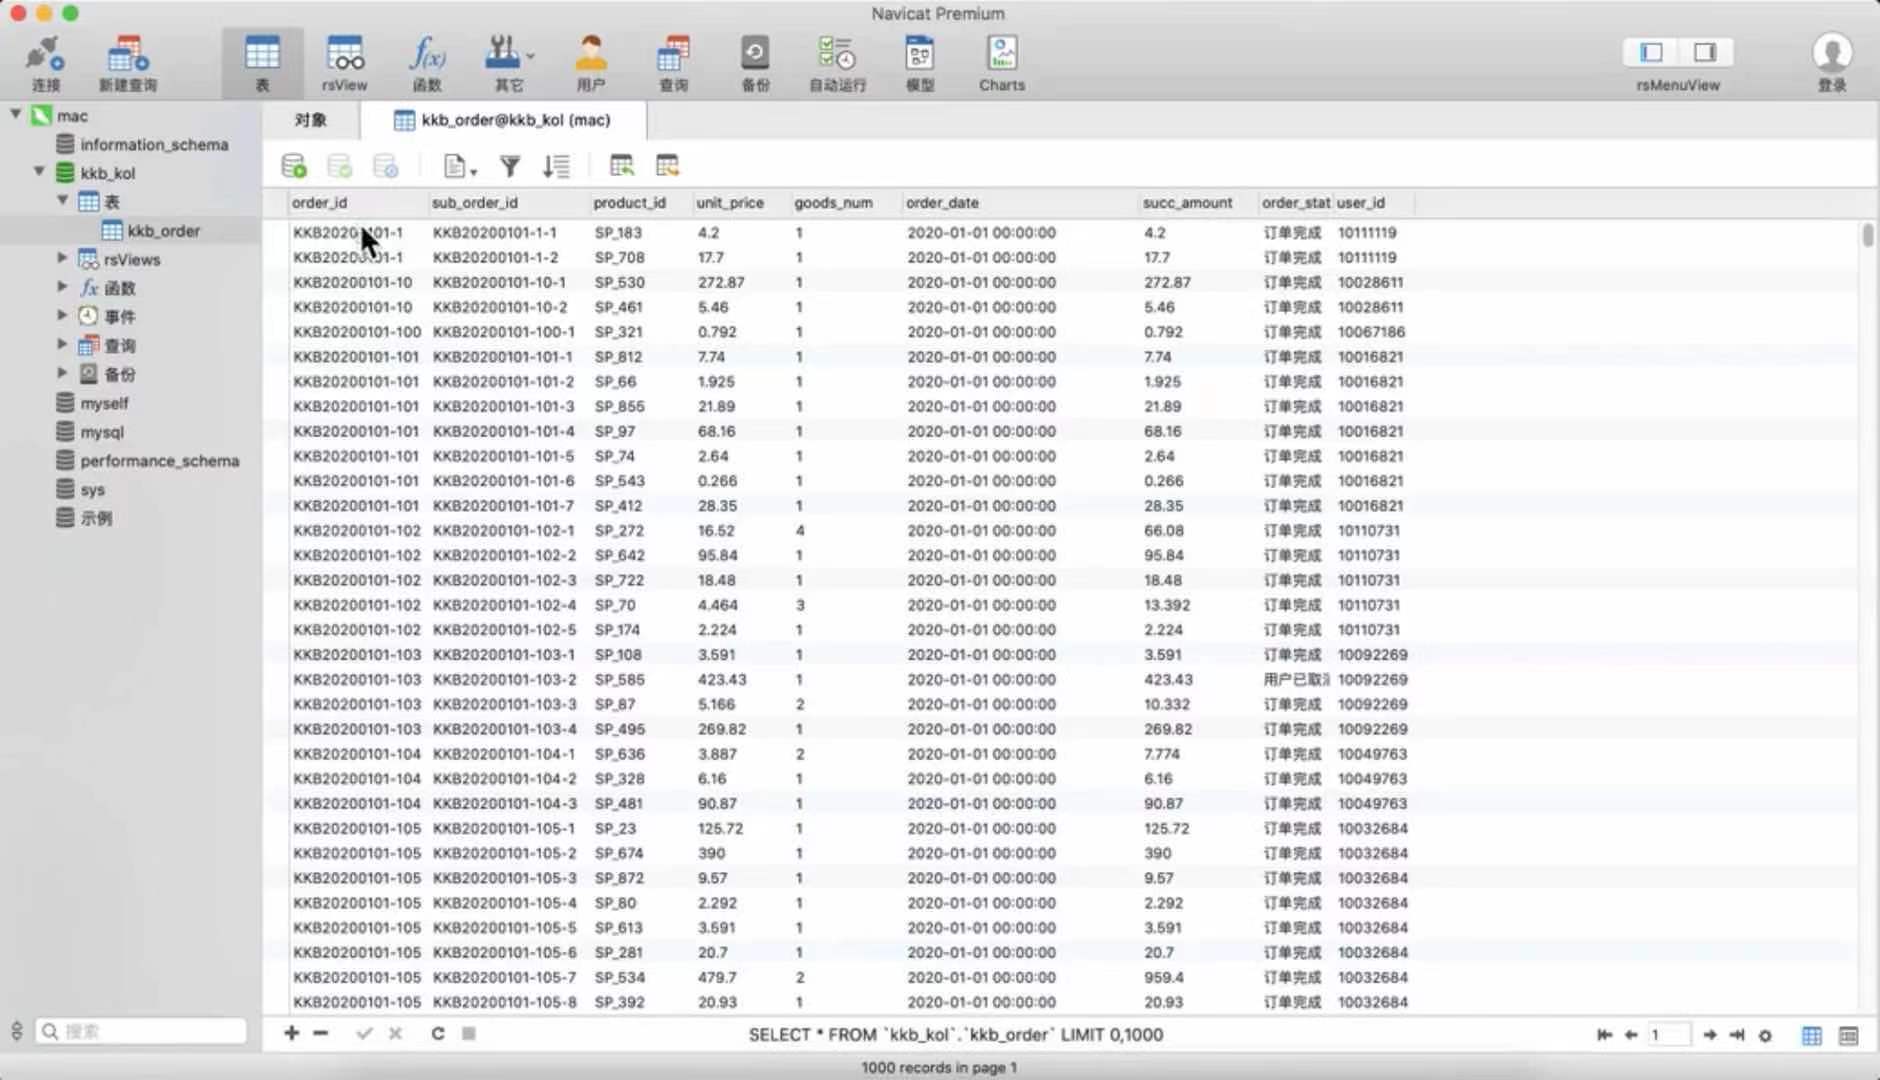
Take the business scenario mentioned above as an example. First, you need to query the sales data in September 2020 in the database. The SQL code and query results are as follows:
Before using the data, it is necessary to evaluate the overall quality of the data. For the case of a large amount of data, there are special data quality products to complete this step; For example: Informatica’s DataQuality, IBM’s QualityStage, Kangaroo Cloud DataValid, Netease EasyDQC, etc., interested students can search for it by themselves.
For data with obvious data quality problems, data cleaning is needed. Data cleaning refers to cleaning dirty data, such as null values, abnormal values and error values, with ETL tools or with the assistance of data development engineers. Excel can also be used to handle the data with a small amount.
The cleaned data can be visualized by Excel, python or professional BI tools, such as tableau, fineBI, etc., and the extracted data can be converted into understandable charts.
There is a saying: ten tables are not as good as one picture. When we take out the data, it is difficult to find out what is wrong with it just by looking at the data. After processing it into the chart we need, it can intuitively reflect the business situation in the emerging stage.
In this skill, we need to learn some data analysis tools such as Excel, Python and BI to help us process and visualize data. Basically, it is more than enough for product managers to learn these three things to do data analysis, so they don’t have to indulge in learning rich tools.
Python data visualization:
BI tool tableau data visualization;
Excel data visualization:
After the first step of fetching and cleaning, use Excel, python and other tools to make a chart, as shown below:

![]()

"Analysis" refers to the analysis of analysis; After fetching, using and processing, we should analyze the meaning of the data according to the business situation.
The first two parts are about what tools are needed for data analysis and what the corresponding tools have done. This part is about how to use data to guide business and help growth.
Through the analysis of the chart obtained in the second step, combined with the purpose of the initial business scenario, we can draw some conclusions of reducing costs and increasing efficiency:
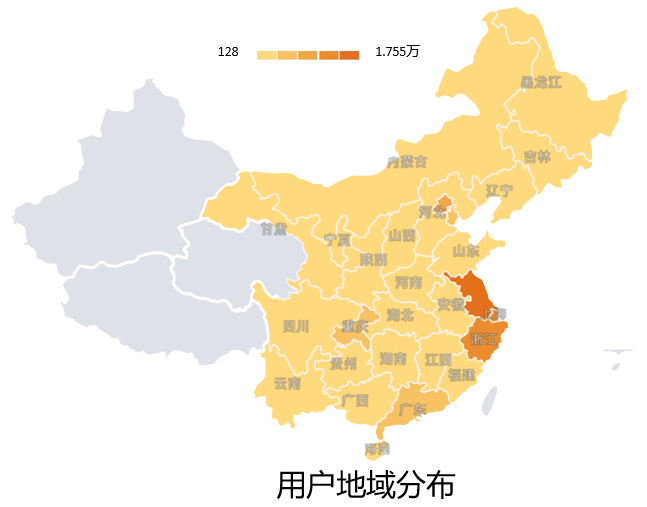
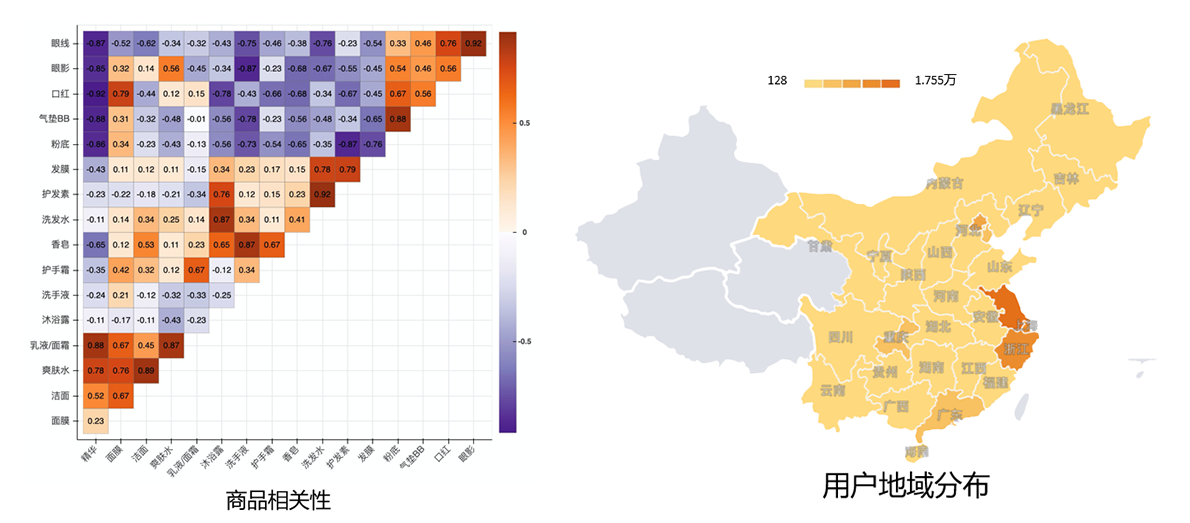
According to the geographical distribution map of users, it can be seen that the user groups are distributed in the Yangtze River Delta region such as Zhejiang and Shanghai, the Pearl River Delta region of Guangzhou and Shenzhen, and the central and western Chongqing region, so you can choose to establish delivery bases in these places to reduce delivery costs;
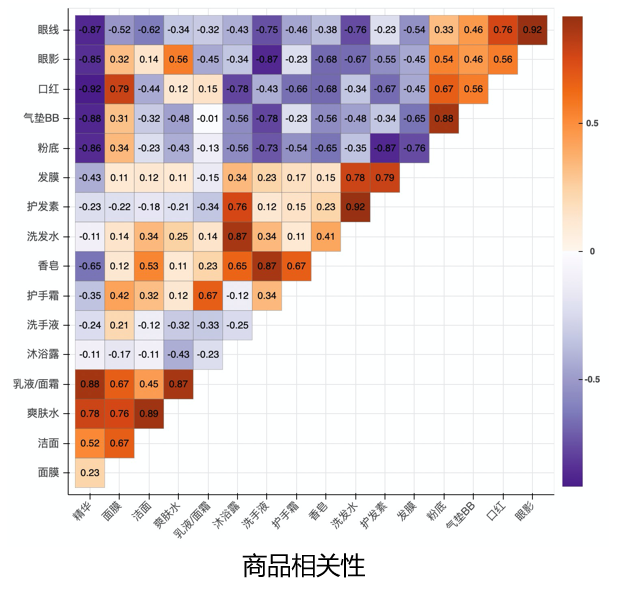
According to the product-related attribute map, it can be seen that the darker the color, the higher the product correlation. For example, the correlation system of lipstick and mask is 0.79, so these two products can be bundled and sold, or when one of them is displayed, another product is recommended at the same time to increase the purchase rate.
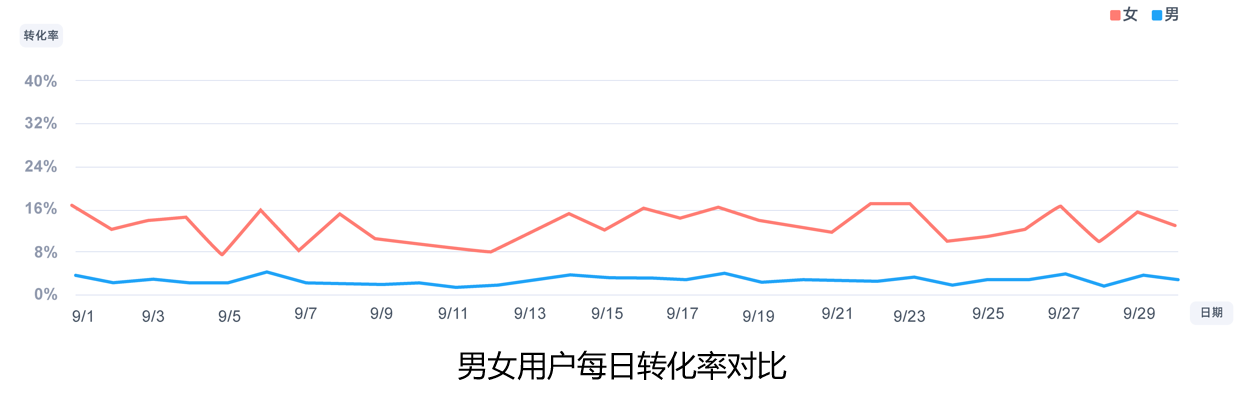
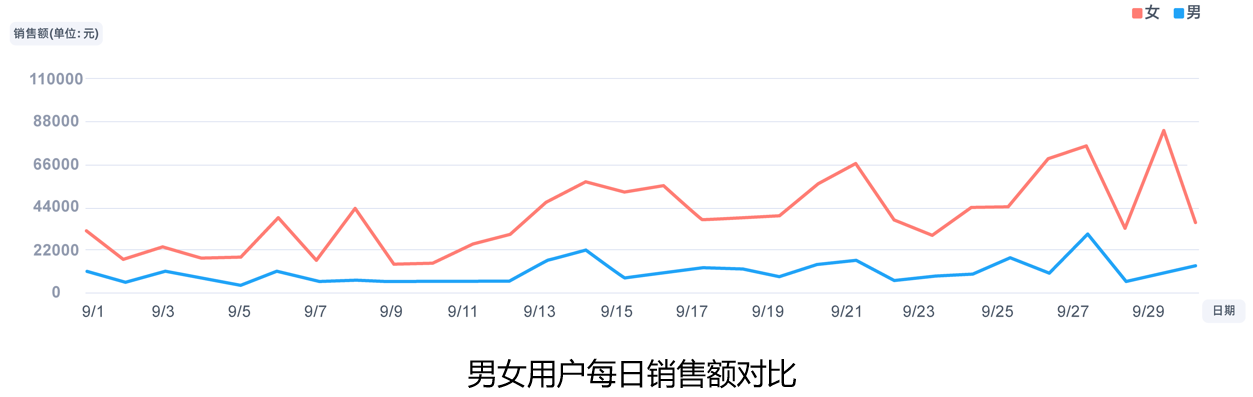
According to the comparative analysis of the conversion rate and sales of male and female users, it is found that the conversion rate of girls is generally higher than that of boys, and the sales rate is greatly influenced by the conversion rate of girls. We can choose to hold more activities mainly for women to improve the conversion rate.
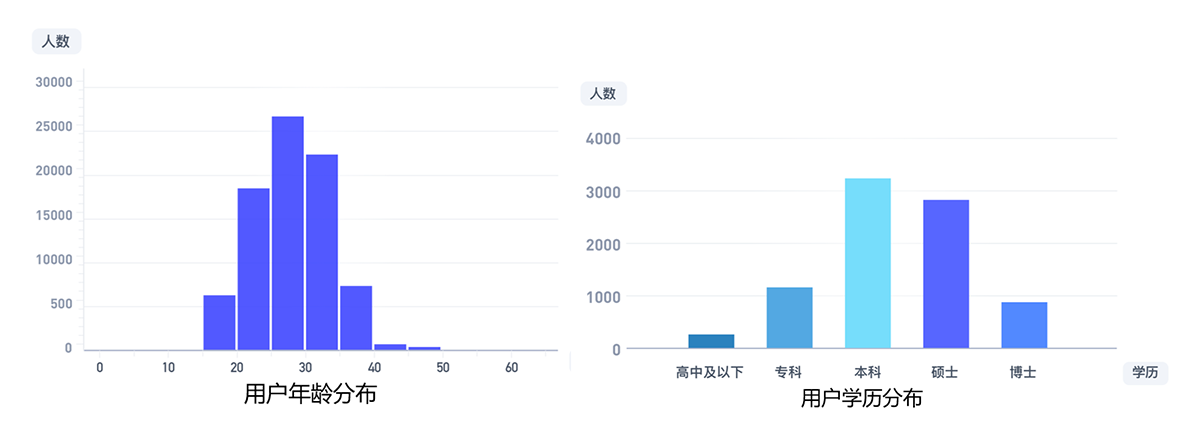
According to the analysis of users’ age distribution map and users’ education distribution map, consumers are generally 20-40 years old, and there are many people with bachelor’s degree and master’s degree, so we can choose such interval users to advertise for innovation.
And so on … After data analysis, we have a preliminary plan for increasing efficiency and reducing costs in business scenarios, so we can make some adjustments and plans for products, operations and sales.
The purposes of data analysis include:
- Exploratory analysis (finding some characteristics from the data and drawing conclusions);
- Diagnostic analysis (analysis of the reasons after something happens);
- Predictive analysis (predicting the impact after something happens);
- Confirmatory analysis (whether verification and guessing are the same after updating product functions or operational activities).
In this business scenario, the purpose of analysis is exploratory analysis, that is, to find out some characteristics from the data and draw some verifiable conclusions, so that the development of the whole business is directional; Therefore, before we do data analysis, we must first clarify the purpose, analyze with the purpose, and determine the suitable data, suitable tools, suitable methods and suitable analysis models.
Not only do data analysis have a clear purpose, but everything should be targeted. Just like the first two skills learning, we must first make clear why we should learn. What do you use it for after you learn it? Learning will get twice the result with half the effort, instead of grasping the beard and eyebrows.
The data analysis process of each industry is similar, but the analysis mode and content are very different. In addition to the basic ability of data analysis, it is necessary to have a knowledge of the industry.
No matter what analytical tools we learn, it is a way to help us work efficiently. The most valuable thing is analytical logic and thinking.
As a product manager, the data analysis skill is still "analysis". How to find the direction to make products better and business grow from data is the skill that we should focus on. I hope everyone can work efficiently, but also need to focus on training their data analysis thinking.
Come on, study! Old irons.
This article was originally published by @ Golden Pea. Everyone is a product manager. It is forbidden to reprint without permission.
The title map comes from Unsplash and is based on CC0 protocol.